Go Execution Tracer
Dmitry Vyukov, dvyukov@
Oct 2014
Abstract
Go has a number of profiling tools -- CPU, memory, blocking profilers; GC and scheduler tracers and heap dumper. However, profilers provide only aggregate information, for example, how much memory in total was allocated at this source line. Tracers provide very shallow information. Heap dumper gives detailed per-object information about heap contents. But there is nothing that gives detailed non-aggregate information about program execution -- what goroutines do execute when? for how long? when do they block? where? who does unblock them? how does GC affect execution of individual goroutines?
The goal of the tracer is to be the tool that can answer these questions.
High-level Overview
A Go program with tracing capability can write trace of interesting events to a file. The capability is compiled into all programs always, and is enabled on demand -- when tracing is disabled it has minimal runtime overhead. That is, the trace can be obtained from a server in production serving live traffic.
The trace contains events related to goroutine scheduling: a goroutine starts executing on a processor, a goroutine blocks on a synchronization primitive, a goroutine creates or unblocks another goroutine; network-related events: a goroutine blocks on network IO, a goroutine is unblocked on network IO; syscalls-related events: a goroutine enters into syscall, a goroutine returns from syscall; garbage-collector-related events: GC start/stop, concurrent sweep start/stop; and user events. Here and below by "processor" I mean a logical processor, unit of GOMAXPROCS. Each event contains event id, a precise timestamp, OS thread id, processor id, goroutine id, stack trace and other relevant information (e.g. unblocked goroutine id).
Once a trace is obtained, it can be visualized and/or processed to extract various types of interesting information. Below you can see a possible visualization:
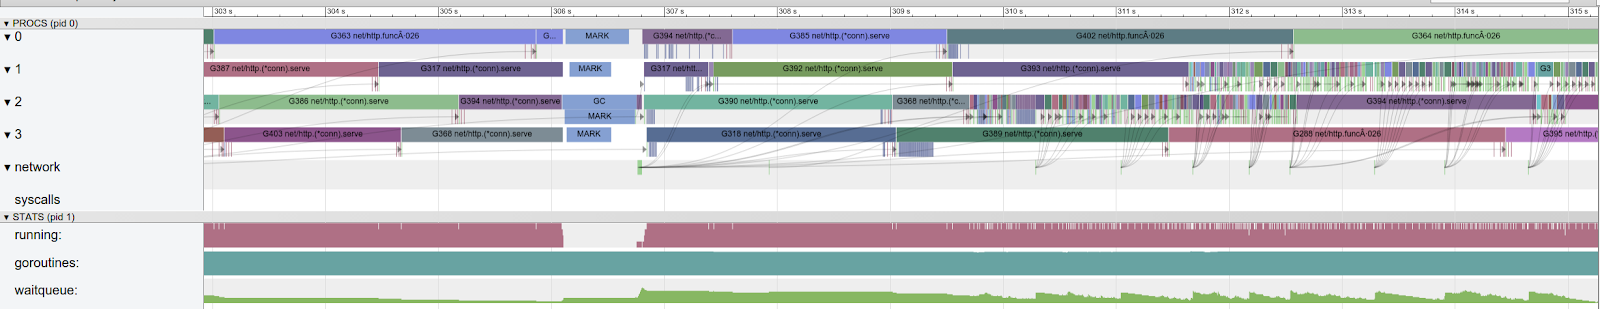
(to zoom: right-click, then select 'Open image in new tab')
Post-processing of the trace can give several useful views:
- a better blocking profiler (go test -blockprofile), it can show not just a sum of blocking time per stack, but a histogram of blocking times with an ability to drill into outliners.
- a better scheduler tracer (GODEBUG=schedtrace), as it can show and explain exact sizes of workqueues, work stealing, thread spinning, number of threads in syscalls, etc.
- what is the min/max/average/histogram IO time for this particular stack?
- what is blocking time and scheduling latency (time between a goroutine was unblocked and actually scheduled for execution) for this select?
- or what is the duration of goroutines created in this place, and then you can look at the outliner in the visual trace to understand why it takes longer than others.
Interfaces
As other profiles, execution trace can be collected in 3 ways:
- Using go test -trace flag. This is intended to be used with a single benchmark:
$ go test -trace=/tmp/trace -run=nothing -bench=MyBenchmark -cpu=8
- Using net/http/pprof handler registered at /debug/pprof/trace. The handler accepts seconds parameter to control duration of the trace.
- Programmatically using interface exposed from runtime/pprof package:
package pprof
func StartTrace(fd uintptr) error
func StopTrace()
Runtime/pprof package also exposes a set of functions for emission of user events:
package pprof
func TraceEvent(id string)
func TraceScopeStart(id string)
func TraceScopeEnd(id string)
TraceEvent writes the id string to trace along with current goroutine id and timestamp. Visualization tools visualize it as a one-off event for the goroutine and show the id string as a hint.
TraceScopeStart/TraceScopeEnd do the same as TraceEvent. But the post-processing tools will be able to understand that these events denote a scope (e.g. a single request processing on a goroutine serving a persistent connection). This will allow to, for example, calculate a histogram of durations of scopes with the same id.
Trace Format
A parallel Go program can generate up to hundreds thousands events per second. So the trace is written in a compact binary format:
Trace = "gotrace" Version {Event} .
Event = EventProcStart | EventProcStop | EventFreq | EventStack | EventGomaxprocs | EventGCStart | EventGCDone | EventGCScanStart | EventGCScanDone | EventGCSweepStart | EventGCSweepDone | EventGoCreate | EventGoStart | EventGoEnd | EventGoStop | EventGoYield | EventGoPreempt | EventGoSleep | EventGoBlock | EventGoBlockSend | EventGoBlockRecv | EventGoBlockSelect | EventGoBlockSync | EventGoBlockCond | EventGoBlockNet | EventGoUnblock | EventGoSysCall | EventGoSysExit | EventGoSysBlock | EventUser | EventUserStart | EventUserEnd .
EventProcStart = "\x00" ProcID MachineID Timestamp .
EventProcStop = "\x01" TimeDiff .
EventFreq = "\x02" Frequency .
EventStack = "\x03" StackID StackLen {PC} .
EventGomaxprocs = "\x04" TimeDiff Procs .
EventGCStart = "\x05" TimeDiff StackID .
EventGCDone = "\x06" TimeDiff .
EventGCScanStart= "\x07" TimeDiff .
EventGCScanDone = "\x08" TimeDiff .
EventGCSweepStart = "\x09" TimeDiff StackID .
EventGCSweepDone= "\x0a" TimeDiff .
EventGoCreate = "\x0b" TimeDiff GoID PC StackID .
EventGoStart = "\x0c" TimeDiff GoID .
EventGoEnd = "\x0d" TimeDiff .
EventGoStop = "\x0e" TimeDiff StackID .
EventGoYield = "\x0f" TimeDiff StackID .
EventGoPreempt = "\x10" TimeDiff StackID .
EventGoSleep = "\x11" TimeDiff StackID .
EventGoBlock = "\x12" TimeDiff StackID .
EventGoBlockSend= "\x13" TimeDiff StackID .
EventGoBlockRecv= "\x14" TimeDiff StackID .
EventGoBlockSelect = "\x15" TimeDiff StackID .
EventGoBlockSync= "\x16" TimeDiff StackID .
EventGoBlockCond= "\x17" TimeDiff StackID .
EventGoBlockNet = "\x18" TimeDiff StackID .
EventGoUnblock = "\x19" TimeDiff GoID StackID .
EventGoSysCall = "\x1a" TimeDiff StackID .
EventGoSysExit = "\x1b" TimeDiff GoID .
EventGoSysBlock = "\x1c" TimeDiff .
EventUser = "\x1d" TimeDiff StackID MsgLen Msg .
EventUserStart = "\x1e" TimeDiff StackID MsgLen Msg .
EventUserEnd = "\x1f" TimeDiff StackID MsgLen Msg .
Version, ProcID, MachineID, GoID, Timestamp, TimeDiff, Frequency, StackID, StackLen, PC, Procs, MsgLen are encoded in Unsigned Little Endian Base 128 (LEB128) encoding. Msg is encoded in utf-8.
Each P collects events in a per-P buffer, the buffer starts with EventProcStart event which contains full Timestamp. The rest of the events in the batch contain TimeDiff which is diff from the previous event (this allows to keep most of the TimeDiff's small and so encoded in fewer bytes). Timestamps has nanosecond precision and are collected with RDTSC. ProcID and MachineID for most events are implied by the previous EventProcStart event. Similarly, GoID, current goroutine id, is implied by the previous EventGoStart event.
EventFreq is written once per trace and denotes the resolution of timestamps in the trace.
EventStack maps StackID to actual stack trace (array of PCs).
EventUser/EventUserStart/EventUserEnd are emitted by user code and allow to denote instant events and duration events, respectively.
The rest of the events describe goroutine scheduling and GC. E.g. EventGoBlockRecv denotes blocking on chan recv; EventGoUnblock denotes unblocking of a goroutine by another goroutine, etc.
User Interface
The user facing part consists of a package that reads, decodes, validates and restores implicit information in the trace, and a set of tools invoked by user. The initial set of options is:
- look at the whole trace (see other screenshots)
- look at the trace for particular goroutine (the tool extracts events only for the requested goroutine and related goroutines), for example:

- look at the list of goroutines and their aggregate characteristics (total time, execution time, time spent in mutex blocking, time spent in network blocking, time spent waiting for GC, etc) (see the screenshot in the Evaluation section)
For trace visualisation it's proposed to use Chromium Trace Viewer (https://github.com/google/trace-viewer). All screenshots in this doc use it.
Evaluation
This functionality is implemented in the following CL:
https://codereview.appspot.com/146920043
There are some minor differences and non-implemented parts. For example, numbers are encoded as uint32 rather than in LEB128; user events are not implemented. But the overall idea matches what's described here.
The change adds ~150 LOC to runtime for event tracking. Most of the added code is trivial like:
if traceEnabled {
traceGCStart()
}
The only non-trivial aspect is detecting when runtime considers that a syscall blocks (and it's also the bulk of the code).
Plus ~550 LOC in a separate file for trace encoding, writing, starting and stopping.
Performance impact when tracing is not enabled is within noise -- global flag check on goroutine creation, blocking, unblocking, etc.
Performance impact when enabled is ~35% on net/http:BenchmarkClientServerParallelTLS4. 75% of the overhead is stack unwinding.
The average size of an event is ~9 bytes in this implementation. With the LEB128 encoding it should be reduced to roughly 5 bytes/event. net/http:BenchmarkServerParallelTLS4 benchmark writes trace at ~1 MB/second speed. That should be reduced to ~0.5 MB/seconds speed with the LEB128 encoding.
We were able to identify 4 issues in Go programs using the functionality:
- Insufficient parallelization in go.types. Type checking of packages happens sequentially. It's very clear from the trace below. The trace allows to understand what exactly is sequential and also to quickly estimate how much time is wasted in the sequential phase:
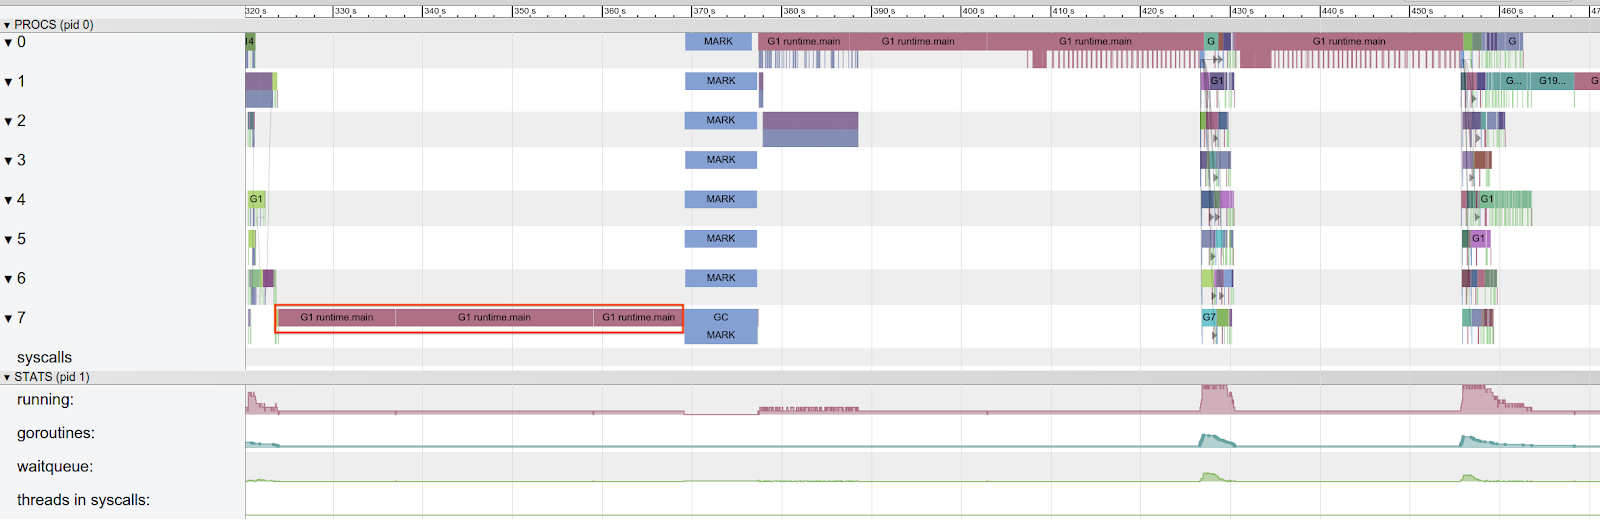
(to zoom: right-click, then select 'Open image in new tab')
- Latency issue due to GC. When GC stops a goroutine, it is put at the tail of FIFO runnable queue. So the unlucky goroutine experience double penalty: a pause due to GC + another wait in runnable queue. In the trace below goroutine 368 experience this situation:
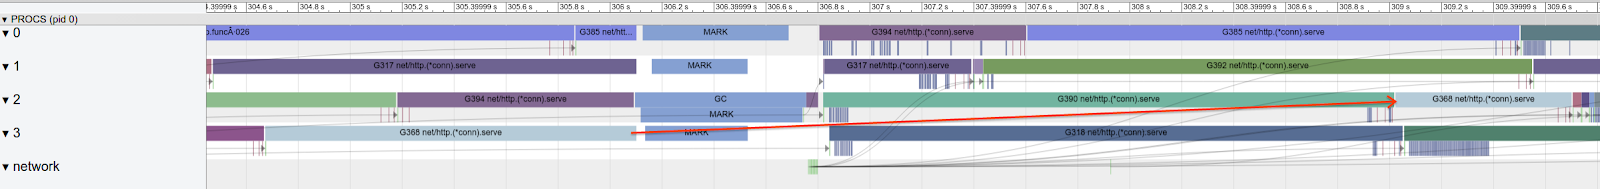
(to zoom: right-click, then select 'Open image in new tab')
- Using the goroutine summary page we identified mutex contention in two different servers. The view compares different goroutines with the same starting function. It makes it easy to compare the fastest goroutines with the slowest goroutines and identify source of slowdown -- whether it's higher computational requirements, network blocking, mutex blocking or GC pauses. Then you can look at traces for individual goroutines to identify exact place of blocking, etc:
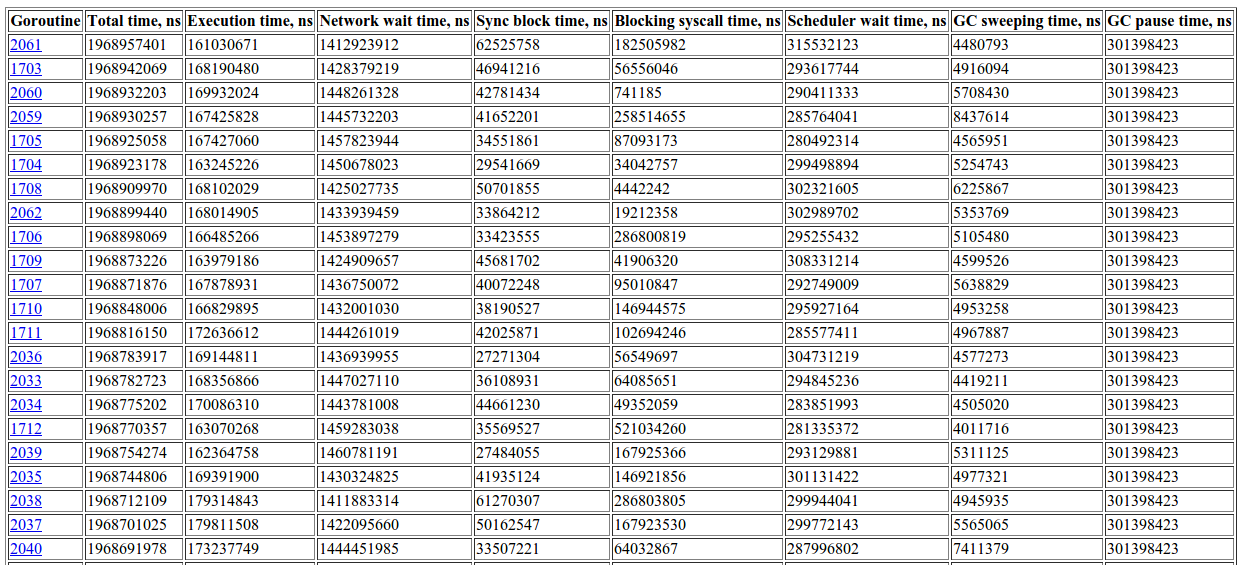
(to zoom: right-click, then select 'Open image in new tab')
Usage:
Apply the changelist and build the toolchain. Then, build your program with the toolchain. You have 2 options for trace collection:
- Run the program with GOTRACE=/tmp/trace env var, then all execution will be traced and the trace written to /tmp/trace.
- Import net/http/pprof and query /debug/pprof/trace?seconds=5 on the running program. The trace for 5 seconds will be downloaded.
Then, checkout https://github.com/google/trace-viewer which contains trace2html program.
To look at the raw trace run:
$ GOROOT/bin/trace -trace=/tmp/trace.json /your/server/binary /the/trace/you/downloaded
$ trace-viewer/trace2html /tmp/trace.json
then open "/tmp/trace.html" in your browser.
To look at the pre-processed trace, do:
$ PATH=./trace-viewer:$PATH $GOROOT/bin/trace -http=localhost:9876 /your/server/binary /the/trace/you/downloaded
This will open a browser window. The page will contain several links:
Goroutines - list of goroutines
IO - stacks where the program blocks on IO
Blocking - stacks where the program blocks on sync primitives and channels
Syscalls - blocking syscalls
Click "Goroutines", then choose an interesting goroutine type (hopefully near top). You will see a list of goroutines with a bunch of characteristics (total time, execution time, blocking time, etc). Then click on various goroutine ids to look at the trace for that particular goroutine -- the goroutine itself will be in the first raw. If you are not familiar with chrome trace viewer, click ? button in the top-right corner.
Note: timestamps are currently off by 1000 in the trace viewer, that is 1 second is actually 1 millisecond.
Here you can download an example of the visualized HTML trace file (6.2MB) to play with locally.